
If you’re a trader and you don’t know any single technical indicator that enables you take decision regarding share prices about where to buy and sell. So you’re really in great loss.
Let’s try to learn RSI which is acronym of Relative Strength Index. Mostly it’s given with index and stocks chart.
What RSI Shows?
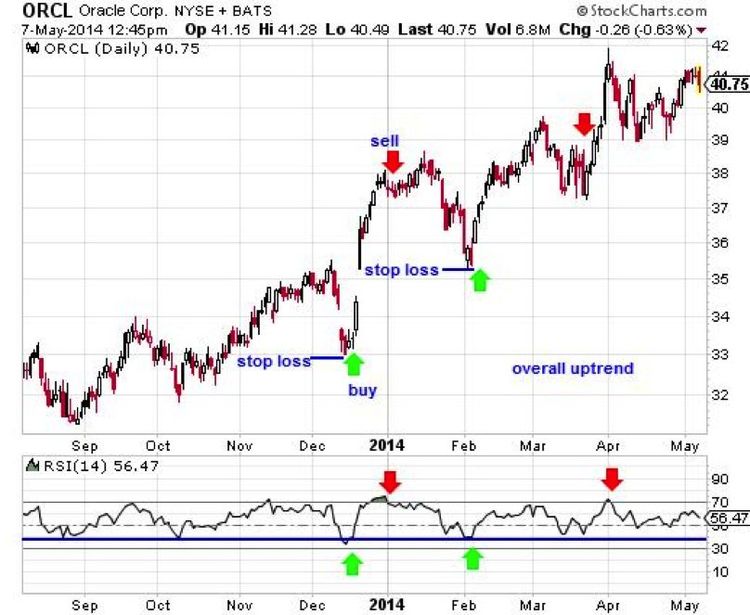
RSI is technical indicator, which guides you in buying and selling of stock/commodities/currencies. It is value in between 0-100 but our concerns with the value among 20-80. 20 is an extreme value indicate that stock is oversold and 80 indicates stock is overbought. These two things give us signal of buying/selling.
How it works?
RSI = 100 – 100/(1 + RS*)
Where RS = Average of x days’ up closes / Average of x days’ down closes.
Let’s take an example of Stock whose price movement is around 53-55 in ten trading days. In it’s trading period, 4 days he faced Negative return and remaining six days number remained in green digits.
| Opening | Closing | Return |
| 52 | 53 | Positive |
| 53 | 55 | Positive |
| 55 | 51 | Negative |
| 51 | 53 | Positive |
| 53 | 58 | Positive |
| 58 | 56 | Negative |
| 56 | 53 | Negative |
| 53 | 51 | Negative |
| 51 | 53 | Positive |
| 53 | 55 | Positive |
We are taking average of Positive closing days(53+55+53+58+53+55=54.5) and Negative Closing Days(51+53+56+51=52.75)
RS = 54.5/52.75= 1.03317
RSI = 100- 100/(1+1.03317)= 50.82

Why we use RSI?
To take decision of buying/selling of stocks. It also help us in short selling(Sell Early, then buy).
They are different types of RSI. 10 Days RSI, 2 Weeks RSI, 1 Month RSI, 1 Quarter RSI etc.
Leave A Comment